|
|
HomeDownloadsScreenshotsShowcase
F.A.Qs |
 |
|
The CSharpCalc showcase
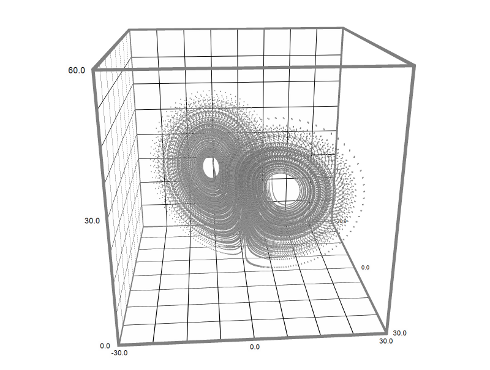
Strange attractors in 3D
This showcase displays views of two famous chaotic attractors, the
Lorenz attractor and the
Roessler attractor using two different visualization methods.
The left column displays the 3D space curves as point clouds. The right column displays the same space curve as 3D object which also visualizes the tangent
plane in each point.
more...
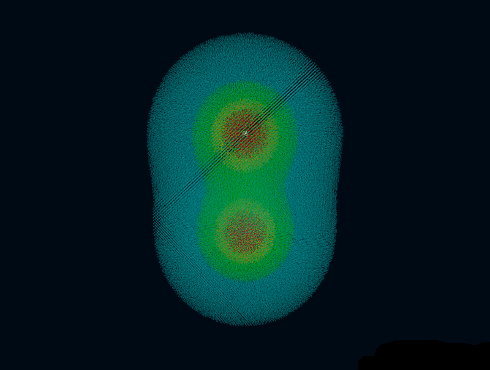
Electric multipole fields
Electric fields play an important role in many areas of
physics. This showcase visualizes the dipole and the hexapole fields with three different sampling rates and two different sampling lattices.
The field strengths were calculated by linear superpositioning.
more...
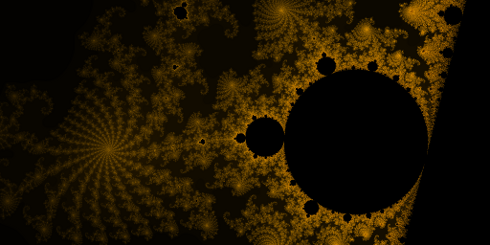
The Mandelbrot set
The Mandelbrot set was named after the mathematician Benoit B.
Mandelbrot. It is well known for its beautiful and self similar structures and the premier example for fractals. This showcase
displays six examples in high resolution using the bronze and silver colormaps.
more...
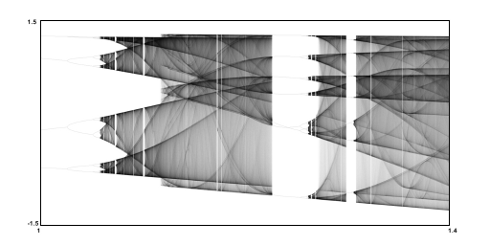
Discrete function maps
Three examples of bifurcation diagrams (also known as orbit diagrams) related to important iterated function maps,
the Henon map,
the logistic map and
the Gauss iterated map.
These maps are frequently discussed examples for systems exhibiting bifurcation and chaotic behavior.
more...
|
Visual examples of scientific computing
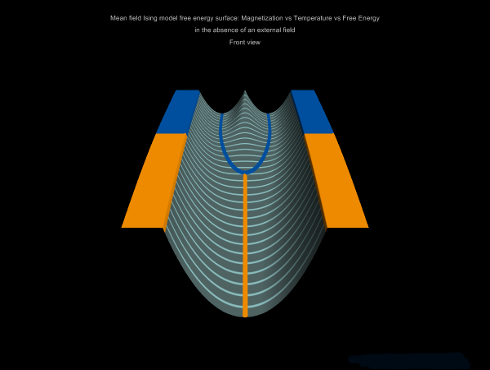
Ising model free energy surface
The Ising model can be approximately solved using the
mean-field approach. This visual shows the free energy of the mean field approximation as a function of the magnetisation and temperature.
The function surface is textured by color coded phase information and by the magnetization curve through the mapping of dynamically
rendered textures.
more...
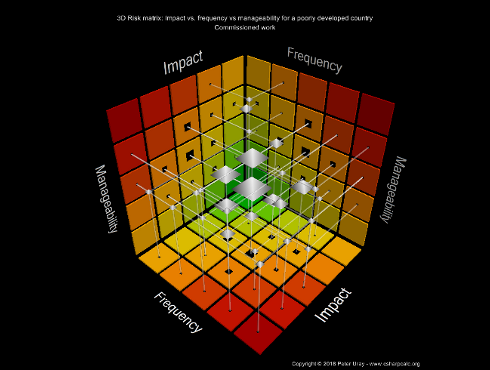
The 3D risk matrix
The concept of risk matrices is being widely used in
risk management as well as in the political and economic analysis of regions. This visual shows bleeding edge research results from an ongoing
project on the topic. The three-dimensional visualization of political and ecomonic stability helps summarizing and communicating complex
analysis results.
more...
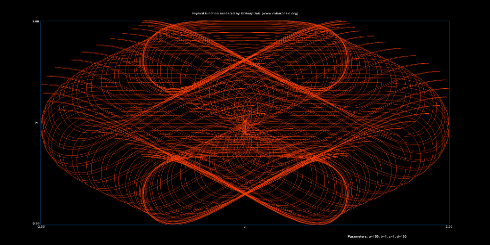
Parametric functions
Graph plots of a selection of sophisticated
parametric equations.
The examples shown are mathematically similar to the famous Lissajous curves. All plots display the (periodic) curves
for parameter values between 0 and 360 degrees.
more...
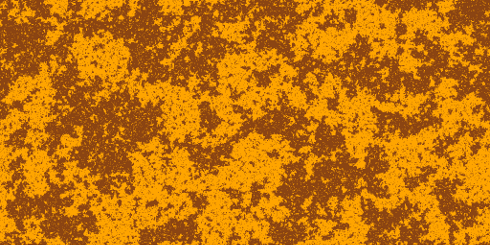
The 2D Ising model
A visualization of high resolution configurations of the 2D
Ising model including two animations of a simulated
annealing of the spin model. These animations are not correct physically but they illustrate the transition from the disorder phase
to the ordered phase. In a physically correct animation the transition happens very fast owing to the steep ascent of the order parameter
as the temperature goes below the critical temperature.
more...
|